

Sold a Story 2, which is a report from American Public Media, released its third episode 22 October 2026. The second season (the “2” in the title) focused on Direct Instruction (“big DI”), a topic about which I have some ideas. During my graduate program in the early and mid-1970s I had to good fortune of learning from Siegfried Engelmann, Douglas Carnine, Wesley Becker, and a horde of others who were closely involved in the genesis of DI.
As I have listened to the first three installments of Emily Hanford’s well-reported podcasts and read the supporting materials (e.g., “Why America’s massive educational experiment didn’t transform schools: In the 1960s, the United States government wanted to find the best way to teach kids who were behind. A federal study called Project Follow Through found an answer. But 60 years later, few schools use it” by Emily Haavik and Olivia Chilkoti), I remembered some images that I used in courses over the years when I talked about DI and Project Follow Through. In this article, I shall simply show those images and provide a few words of explanation for them.
Local education agencies chose which model they wanted to implement in their schools. The LEAs literally attended a meeting where representatives of each of the sponsors did a show-and-tell about what they would hope to accomplish in classrooms affiliated with their model. The sponsors were among the most popular advocates of reforming what was going on in schools. They came with lots of ideas about how to do education better.1
When they selected the model they wanted to implement early childhood education in their LEA, the districts reached agreements with the Office of Education to receive not just the particular sponsor’s consultation and support but also to receive certain benefits. These benefits were essentially the same regardless of sponsor. Schools were to get funding for additional staff (e.g., teacher aides for each classroom). But the districts had to agree to provide medical and dental services, nutritional programs, social service programs, and guidance and psychological services. That is to say that signing up with a particular sponsor, the LEA did not gain such health or nutrition benefits that they would not have gotten with a different sponsor; those non-instructional services were essentially equivalent.
Follow Through outcomes
In this section I provide bar graphs comparing outcomes for nine of the models of instruction tested in the Follow Through study. The data for the graphs come from reports submitted by Linda B. Stebbins and colleagues of Abt Associates, an evaluation firm hired independently by the US Office of Education.2
Just start with this global overview. It compares outcomes for students in the DI model classrooms with all the other models combined.
Each bar shows an average. The lines with show the dispersal (think of it as deviation from the mean).
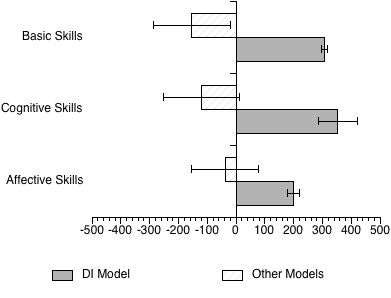
Clearly, DI looks pretty good. But those “error bars” show a good bit of variation. Might some of the different models actually have done better?
Model-x-models
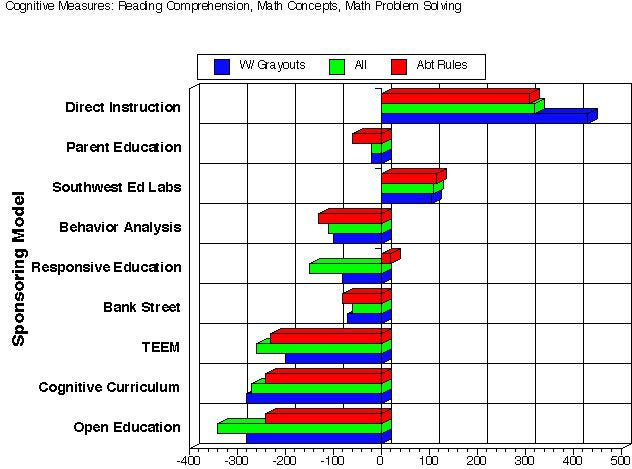
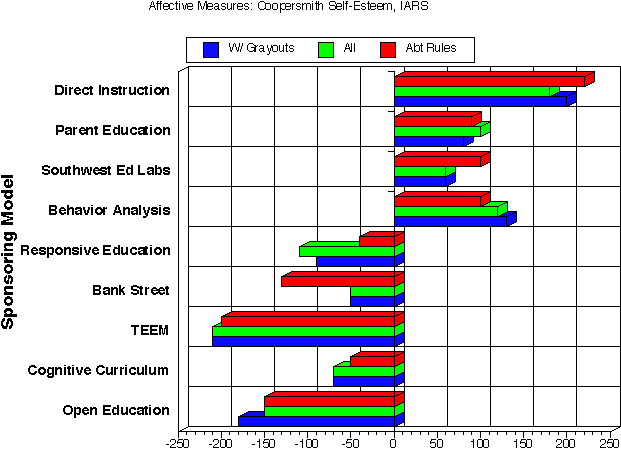
Here are graphs across the three outcome areas showing how well each model did in each area. Each graph has a common configuration. Along the left side are the names of the various sponsors or models. The scale across the bottom shows the proportion of times that classrooms of children in the sponsor’s locations had better or worse outcomes than children in the comparison classrooms for that model.3 The colored bars show different ways of counting how many times the sponsor’s classrooms or the comparison classrooms had higher outcomes.4
Here are images showing the scale and key separately.

In the rules for counting, one could use (a) the original Abt system of plusses and minuses (blue) or the original Abt system but include those that Abt “grayed out” (red) because Abt had reservations about the match between the sponsor and comparison classes. Alternatively, one could count all the comparisons (green). As we shall see, the different counting rules do not make much of a difference. The pattern of results is consistent regardless of which counting system one used.
One could then divide the number of positive (or negative) counts by the number of possible counts and get an index of significant outcomes, which could then be plotted along the scale at the bottom of each graph.

Basic skills outcomes
Here is a graph showing the comparison of the models on the measures of basic skills.
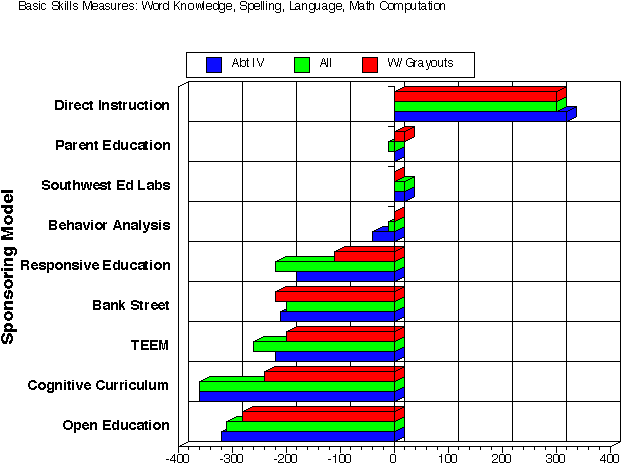
It is pretty obvious that in the areas of word reading, spelling, computing, and language (as measured by the Metropolitan Achievement Test), the DI model beat the pants off all the others.
Cognitive outcomes
Of course, many people would not find the outcomes about basic skills to favor DI. But the other models, with their emphasis other aspects of learning should do better on higher order thinking. Right? The DI kids would slip in reading comprehension, math concepts, and math problem solving…right?
Affective outcomes
“OK, OK,” some might say. But these other models really emphasized the whole child and building strong self-concepts as the foundation of learning. The DI classrooms did not emphasize those aspects of education.
Low achievement
I previously published a post with another graphic that I created. In “Some early reading approaches yield fewer failing students: Which approaches have fewer learners a year or more behind?” I showed an image of the percentages of children from the different FT models who scored 1 or more grade levels below their age placement.
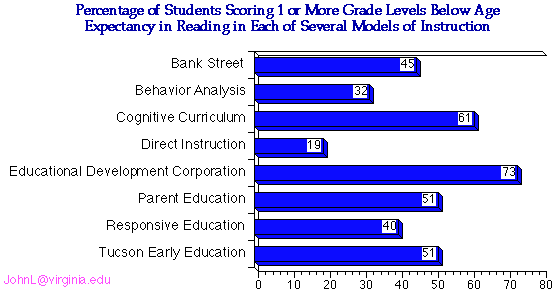
In this graph, the stronger outcomes are lower. That is, the FT models that had fewer students scoring below grade level were doing better. This should be a big hint to those folks who today are interested in “Tier 1” core instruction, especially because these results come from classrooms and schools that faced terrific challenges (serving high poverty communities, with many single parent families, etc.).
Comments
There are a lot of data buried in these graphs. They represent the outcomes for 1000s of children and 100s of teachers over multiple years. Some readers may need a bit of time to digest the graphs!
The structure and conduct of the FT study rules out a lot of potential objections to the results. Detractors cannot get away with saying, “Oh, it was just one good teacher; that’s why those kids did well.” It is hard to say, “Well, they just got the right test,” when there were multiple different tests administered by independent testers.
To be sure, there were (and are) those who dismiss the FT results. Indeed, a group of rightly famed evaluators completed a strongly stated critique (House et al. 1978). I shall return to the topic of criticisms of the FT study in a subsequent post.
I also want to remind readers that this was not a special education study. The participating students were not selected because they had disabilities. Only some of the sponsors had special education connections.
References
House, E., Glass, G., McLean, L., & Walker, D. (1978). No simple answer: Critique of the Follow Through evaluation. Harvard Educational Review, 48(2), 128-160.
Nero and Associates. (1976). A description of Follow Through sponsor implementation processes. Portland, Oregon: Author. Eric: ED 128 926
Stebbins, L. B., Anderson, R., Baltzell, C., Brooks, C., Evans, P., Ferb, K., Ferb, T., Freshet, P., Friedman, S., Hagerty, M., Jastrzab, J., Katzenstein, E., Keef, K., Ladner, R., Mackiernan, Y., Mignolla, E., Nelson, B., Piper, C., Poppe, D., Proper, E., St. Pierre, R., & Watkins, M. (1976). Education as experimentation: A planned variation model. Vol. III-A: Findings Cohort II, Interim findings: Cohort III. ABT Associates.
Stebbins, L. B., St. Pierre, R. G., Proper, E. C., Anderson, R. B., and Cerva, T. R. (1977). A planned variation model. Vol. IV-A Effects of Follow Through models. U.S. Office of Education, Washington, DC.

Footnote
The model sponsors represent popular approaches of the time. Here is a list of simplified descriptions of some of them drawn from Nero and Associates (1976):
Bank Street—This method was concerned about the kinds of people that children should become: confident, inventive, responsive, productive human beings. Language and reading permeates the whole environment. Initially children learn to read through the recording of their own experiences and reading is taught as a useful and pleasurable skill. The classroom is arranged so that it encourages children to choose their activities, when appropriate, within the context of a carefully planned curriculum which stresses social studies.
Behavior Analysis—This model recommended systematic and precise use of positive reinforcement in classroom instruction. Classroom interactions should emphasize the use of positive reinforcement. Classrooms should be orderly but interesting places. Reading should begin with phonics based instruction and progress to comprehension activities.
Cognitive Curriculum (High Scope)—Teachers should establish an environment in which the children may have active experiences with a variety of objects, people, and materials. On a daily basis, children should plan, work to complete those plans, and informally present the products of their work to the teacher and to peers. The curriculum should include the highly integrated use of sciences, crafts, and arts. Activities should permit children to experience relationships directly as they generate products and events of personal value.
Direct Instruction—The method emphasized (a) working in small groups, (b) using programmed instruction, (c) teaching intelligent behavior, (d) using reinforcement, and (e) monitoring child performance. Early reading instruction should emphasize learning sound-symbol relationships, blending, and similar decoding skills, but should rapidly progress to incorporating comprehension skills.
Educational Development Corporation—This method’s goal was to develop self-reliant, self-motivated, socially responsible and intellectually competent individuals, who can achieve their fullest potential, regardless of antecedents. These classrooms are based on several assumptions, including: (1) Natural and homemade materials that children and their teachers bring into the classroom are as important as the commercial materials provided by the school and (2) the physical environment of the classroom should reflect the incorporation of the children’s needs, strengths, interests, and activities.
Parent Education—The aim of this model was to create tasks that are soundly based on Piagetian educational philosophy. The lessons should give children meaningful experiences with a balance between the cognitive, affective, and psycho-motor skill areas. Parents should be heavily involved in teaching their children fundamental skills.
Tucson Early Education Model—The proponents of this view argued that the child acquires vocabulary for things, objects, and relationships that have been experienced. Based on these assumptions, the method emphasizes a language experience approach. Children should talk about experiences, dictate accounts of them, and use those products in learning reading. How a child learns is seen as equally important as what a child learns.
It is important for readers to know that Abt Associates was an independent contractor. Abt was not associated with any of the sponsors of the various models. Also, one should know that the data analyzed by Abt were collected by another independent contractor; Stanford Research Institute (now known as SRI) was hired to conduct the testing and aggregate the data from the many different sites where FT was implemented. SRI did not have ties to any of the model sponsors.
Comparison classrooms were selected by locating schools with similar demographics. They were not precisely matched, but were roughly equivalent on relevant factors such as SES, single-parent homes, pre-school (Head Start) experience, etc.
The Abt evaluators provided a table for each sponsor showing whether the sponsor’s classes did better than the comparison classes on each measure at each location.